SilverLight chart rotate axis label
SilverLight Column chart rotate axis Example :
In this example i explained how to rotate x axis label of a Column series chart in silverilght. I directly go to the coding part.
OutPut Screen :


Note:You can do this for all kind of charts in silverlight by changing X and Y axis based on your requirements.
OutPut Screen :


Add the following dll to your References:

Add the Following name space in xaml code:

xmlns:layout="clr-namespace:System.Windows.Controls;assembly=System.Windows.Controls.Layout.Toolkit"
Xaml Code :

<Grid x:Name="LayoutRoot" Background="White">
<toolkit:Chart HorizontalAlignment="Left" Margin="12,12,0,0" Name="chart1" Title="chart1" VerticalAlignment="Top" Height="266" Width="365">
<toolkit:ColumnSeries DependentValuePath="X" IndependentValuePath="Y" ItemsSource="{Binding}"DependentValueBinding="{Binding Count}" IndependentValueBinding="{Binding Month}"/>
<!-- add the rotating code here -->
</toolkit:Chart>
</Grid>
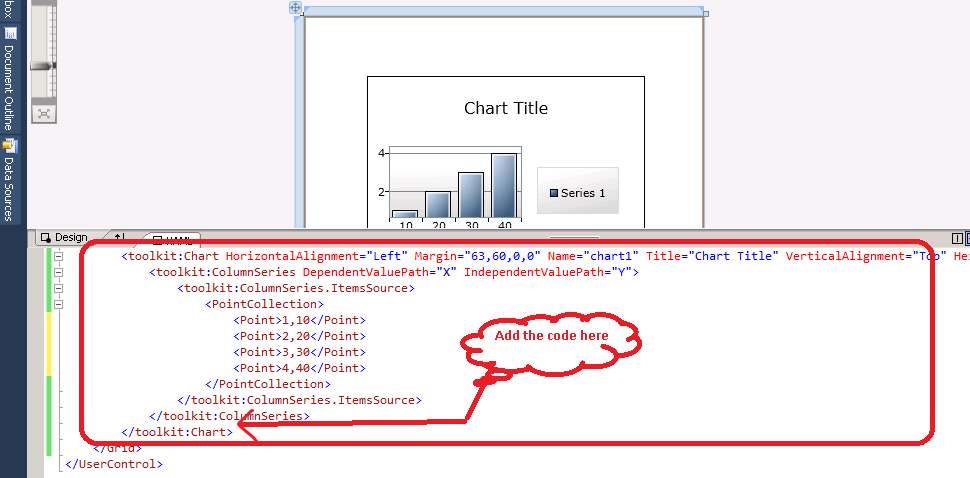
Rotating Code:
Add the following code between the chart.See the following image

<toolkit:LinearAxis Orientation="Y" Minimum="0" Height="auto"/>
<toolkit:CategoryAxis Orientation="X">
<toolkit:CategoryAxis.AxisLabelStyle>
<Style TargetType="toolkit:AxisLabel">
<Setter Property="Template">
<Setter.Value>
<ControlTemplate TargetType="toolkit:AxisLabel">
<layout:LayoutTransformer>
<layout:LayoutTransformer.LayoutTransform>
<RotateTransform Angle="-90"/>
</layout:LayoutTransformer.LayoutTransform>
<TextBlock Text="{TemplateBinding FormattedContent}"/>
</layout:LayoutTransformer>
</ControlTemplate>
</Setter.Value>
</Setter>
</Style>
</toolkit:CategoryAxis.AxisLabelStyle>
</toolkit:CategoryAxis>
</toolkit:Chart.Axes>
Note: Here you can add any events to the axis label.You can add it to the textblock in the above code(in ControlTemplate ).
cs code :

using System;
using System.Collections.Generic;
using System.Linq;
using System.Net;
using System.Windows;
using System.Windows.Controls;
using System.Windows.Documents;
using System.Windows.Input;
using System.Windows.Media;
using System.Windows.Media.Animation;
using System.Windows.Shapes;
namespace ChartSample
{
public partial class MainPage : UserControl
{
List<ChartData> lobjchart;
public MainPage()
{
InitializeComponent();
lobjchart = new List<ChartData>();
lobjchart.Add(new ChartData() { Month = "Jan", Count = 10 });
lobjchart.Add(new ChartData() { Month = "Feb", Count = 20 });
lobjchart.Add(new ChartData() { Month = "March", Count = 30 });
chart1.DataContext = lobjchart;
}
}
public class ChartData
{
public string Month{ get; set; }
public double Count{ get; set; }
}
}

Comments
Post a Comment