display minimum and maximum values for LinearAxis in Silverlight Toolkit's columnseries
minimum/maximum values & showgridline properties in silverlight chart axis:
Add the following XAML code,above the last line of your chart. see the following image
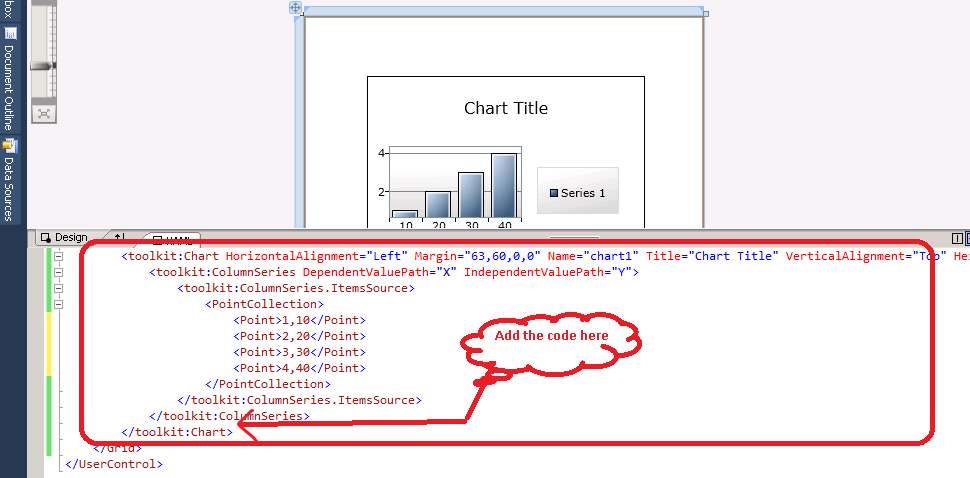
code:
<toolkit:Chart.Axes>
<toolkit:LinearAxis Orientation="Y" Minimum="0" Maximum="100" Height="auto"/> </toolkit:Chart.Axes>

You can set intervels & show or hide gridlines also:
For example in that same code you can add intervel property. example
<toolkit:Chart.Axes>
<toolkit:LinearAxis Orientation="Y" ShowGridLines="False" Minimum="0" Maximum="100" Interval="20" Height="auto"/> </toolkit:Chart.Axes>

Output:


Comments
Post a Comment